Dashboard Report
Dashboard Report
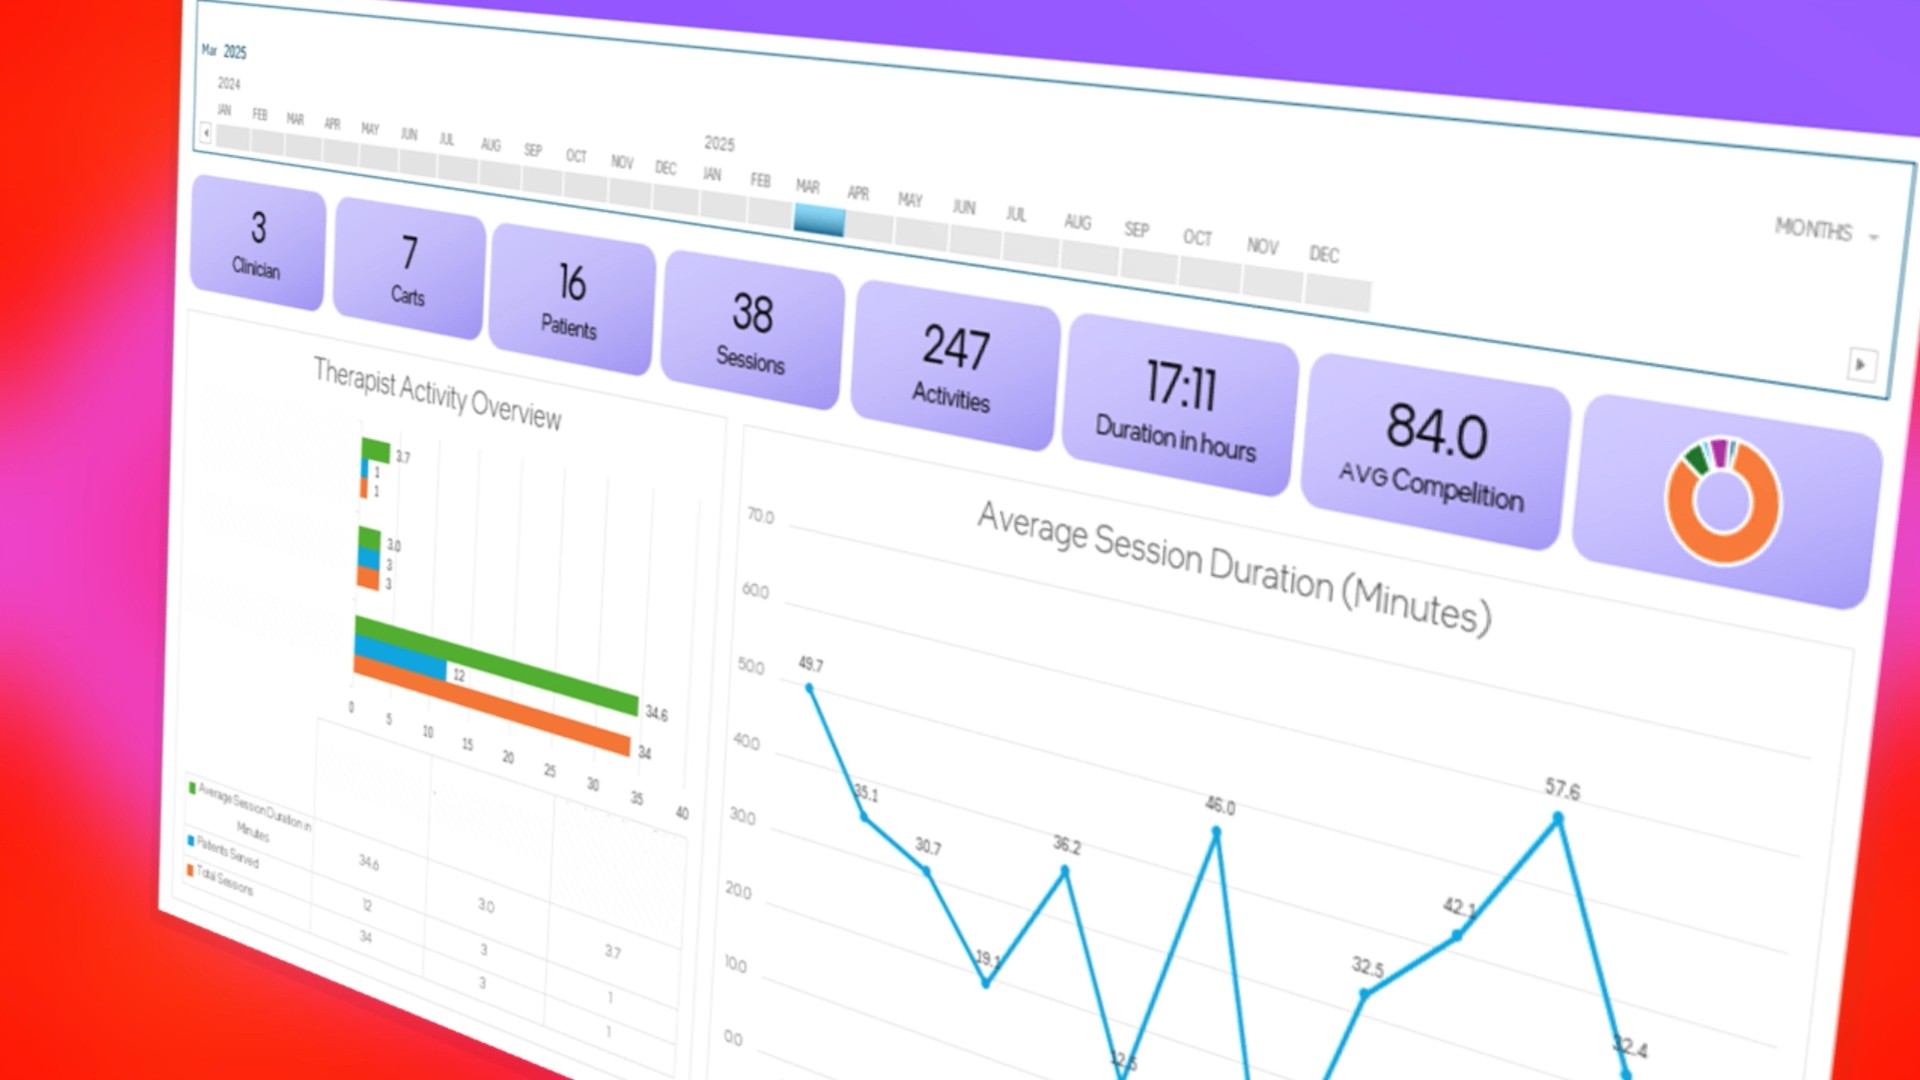
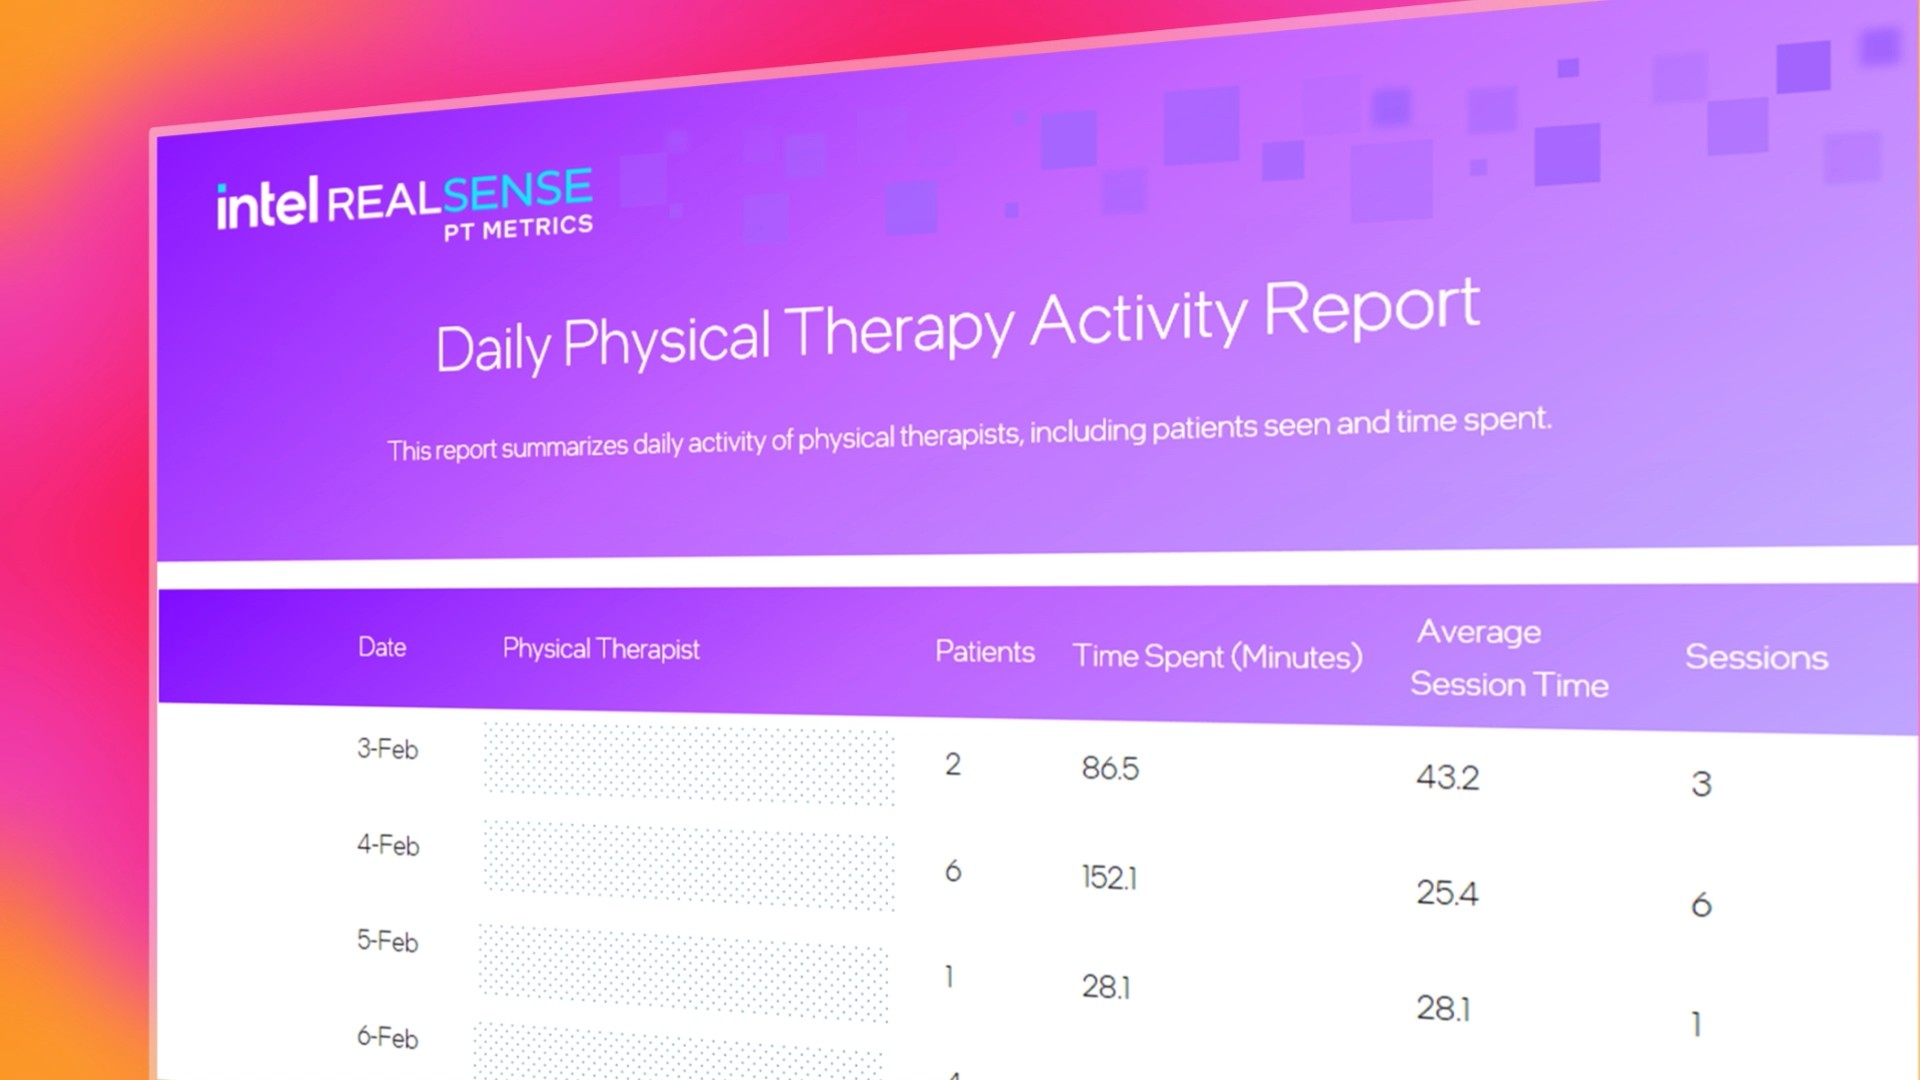
I designed the Company Usage Report in Excel, seamlessly connected to a SQL Data Warehouse, making it both powerful and easy to use (yes, Excel can still be cool). It tracks key clinic metrics like the number of clinicians, patients, completed sessions, and average activity duration—all in a clear, no-nonsense format. Management has praised its clarity and usability, which is always a nice bonus. To keep customers in the loop, a printable version is sent out monthly, delivering a professional summary of their clinic’s performance—because everyone loves a well-organized report.
I designed the Company Usage Report in Excel, seamlessly connected to a SQL Data Warehouse, making it both powerful and easy to use (yes, Excel can still be cool). It tracks key clinic metrics like the number of clinicians, patients, completed sessions, and average activity duration—all in a clear, no-nonsense format. Management has praised its clarity and usability, which is always a nice bonus. To keep customers in the loop, a printable version is sent out monthly, delivering a professional summary of their clinic’s performance—because everyone loves a well-organized report.
Date
2025
Tech
Excel, SQL


Yoel Mizrahi
Software Developer
IL
2:09:52 PM